 |
| Group 1 used coins from various countries. |
 |
| Group 3 looked at Mardi Gras beads and grouped them according to color. |
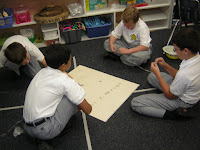
Our class just wrapped up Unit 2 in Math. As a culminating activity, the class broke up into groups and created bar graphs from items brought from home. The groups had to analyze the items and determine the best way to catagorize them. The mode, median, minimum, maximum, and range all had to be found. The students were highly engaged and the graphs were amazing!
 |
| Group 2 used paper clips of various sizes. |
 |
| Group 4 brought in jelly beans and peanut buttercups. |